fxcodebase-backup
Cash Cow Strategy Signal
Source: https://fxcodebase.com/code/viewtopic.php?f=29&t=1317
Forum: 29 · Topic 1317 · 3 post(s)
Cash Cow Strategy Signal
Apprentice · Sun Jun 13, 2010 4:52 am
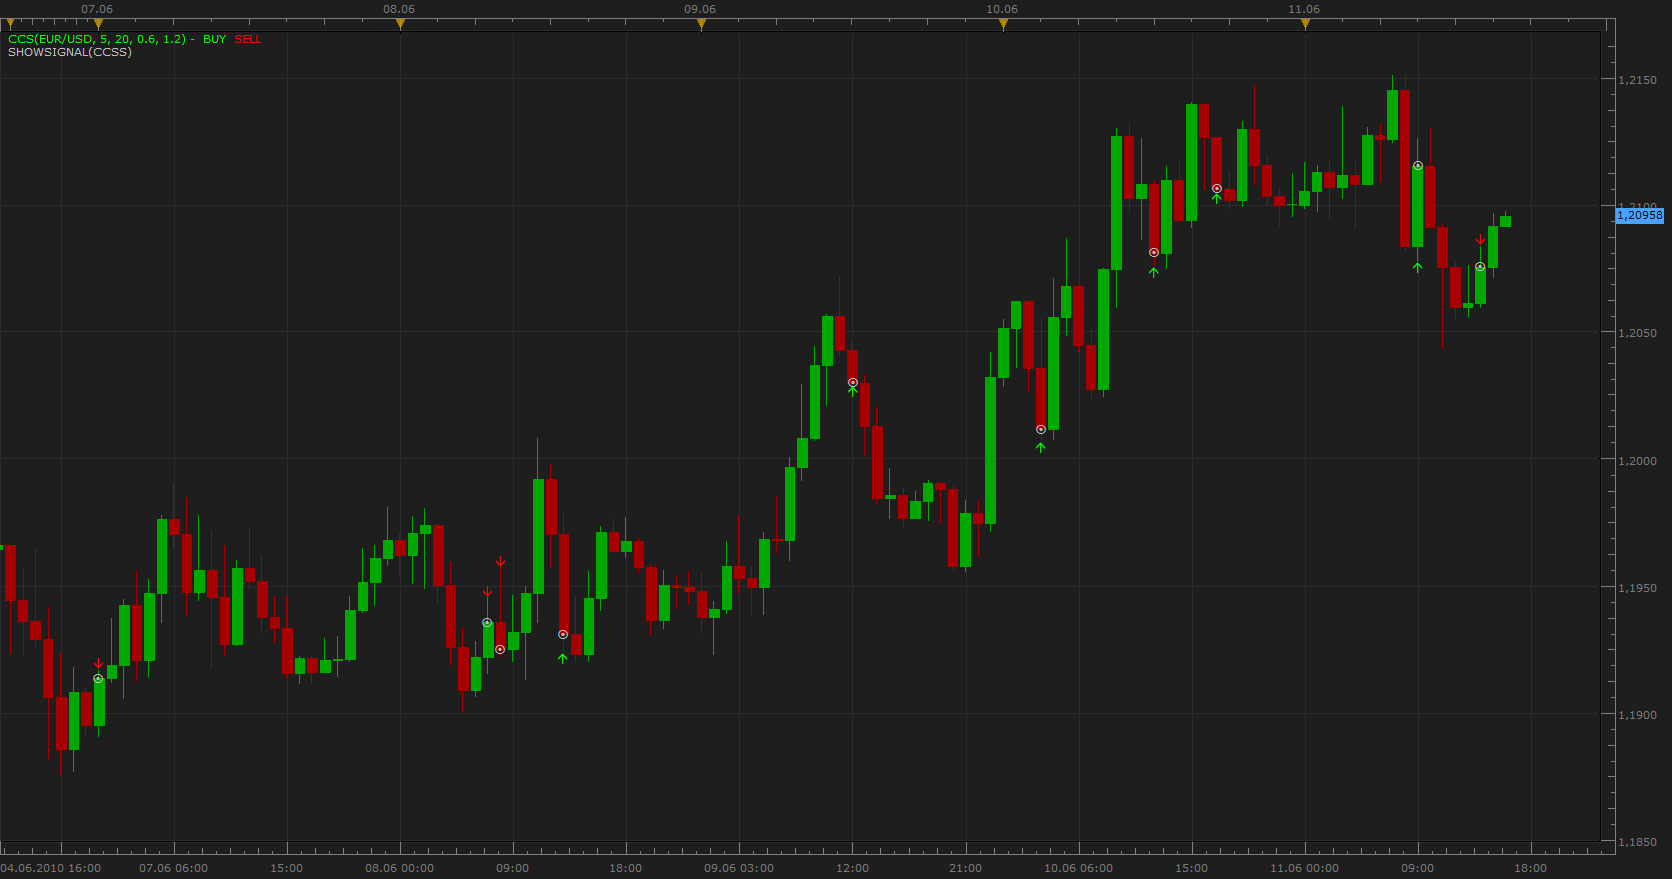
Cash Cow Strategy Signal
This Signal was created based on requests,
Entry Signal (Long) EMA (5) & EMA(20) are raising EMA (5) > EMA (20)
Close > Lower 1.2% * Ema (5) Envelope Close < Ema (5)
High < Upper 0.6% * Ema (5) Envelope High > Ema (5)
Entry Signal (Short) EMA (5) & EMA(20) are falling EMA (5) < EMA (20)
Close < Higher 1.2% * Ema (5) Envelope Close > Ema (5)
Low > Lower 0.6% * Ema (5) Envelope Low < Ema (5)
Request and complete strategy can be found here http://fxcodebase.com/code/viewtopic.php?f=27&t=1223&start=0
NOTE I had NOT have a chance to test the signal on the dynamic data
Re: Cash Cow Strategy Signal
colinr · Tue Jun 15, 2010 1:48 pm
Many Thanks
Re: Cash Cow Strategy Signal
d-jack · Tue Aug 10, 2010 7:45 am
Help please, CCSS I found the download for the verbiage on how this functions but there must be another download for a software that enables using multiple figures i.e. 5 EMA envelopes +/- 0.6 & 1.2%. Would someone be so kind as to point me in the right direction please. “D”