fxcodebase-backup
OSMA (MACD Histogram) Strategy
Source: https://fxcodebase.com/code/viewtopic.php?f=31&t=4881
Forum: 31 · Topic 4881 · 14 post(s)
OSMA (MACD Histogram) Strategy
Apprentice · Mon Jun 27, 2011 10:39 am
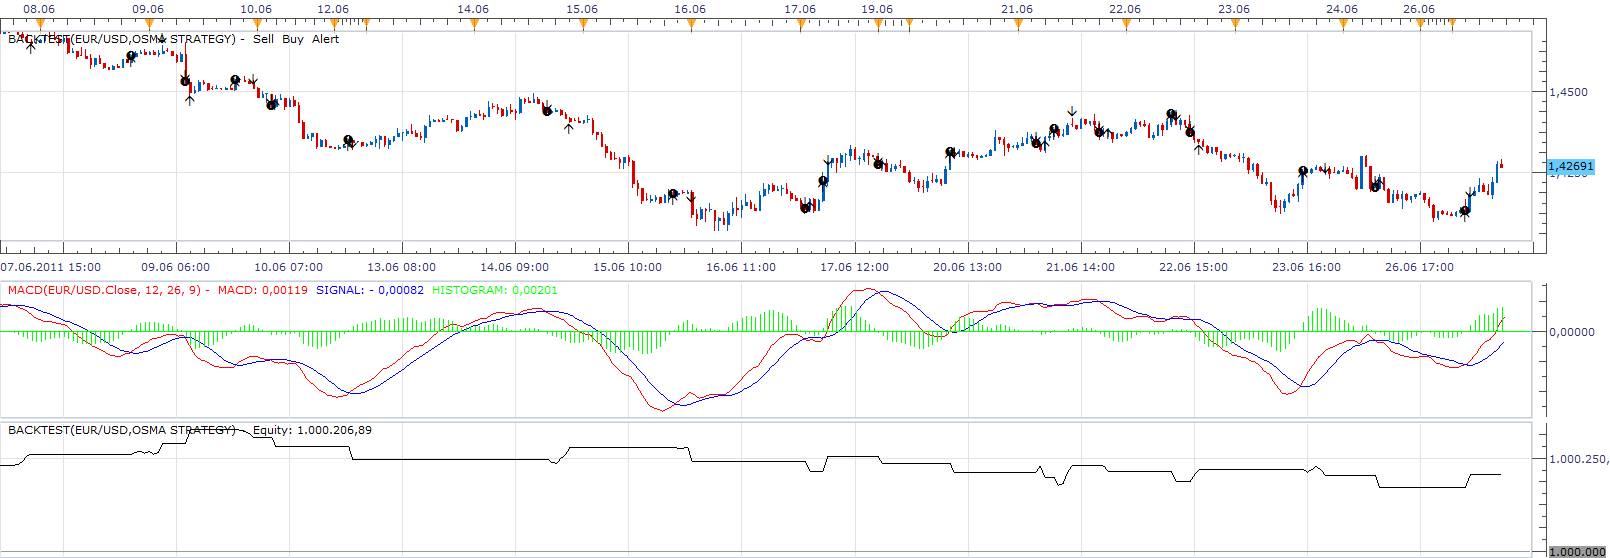
Based on OSMA Indicator. viewtopic.php?f=17&t=1856&p=7294&hilit=OsMA#p7294 OsMA is Difference between the Moving Average Convergence/Divergence and the signal line.
The signal provides three types of signals. Histogram Zero Line Cross, Histogram Top / Bottom, Histogram Reverse.
Histogram Top / Bottom signal is generated whenever the indicator changes color. Top signal is given only when the OsMA is in a positive territory. Bottom signal is given only when the OsMA is in negative territory.
Histogram Reverse signal is generated whenever the indicator changes color.
The Strategy was revised and updated on December 18, 2018.
Re: OSMA (MACD Histogram) Strategy
friedrio · Tue Apr 10, 2012 7:47 am
Hi Apprentice,
can you combine:
average strategy and Osma strategy ???
thy friedrio
Re: OSMA (MACD Histogram) Strategy
Apprentice · Fri Apr 13, 2012 1:36 am
I will try to offer something soon.
Re: OSMA (MACD Histogram) Strategy
Apprentice · Fri Apr 13, 2012 4:00 am
Try this Version viewtopic.php?f=31&t=15927
Re: OSMA (MACD Histogram) Strategy
jfost2010 · Tue Jun 19, 2012 11:06 am
Hi.
I installed this indicator and set it up for the 1M timeframe to test it and it does not make trades. I also backtested it and still no trades. I am using the settings
Top/Bottom Short EMA: 9 Long EMA: 64 Signal: 112 Price Type: Close
Type of signal: Direct
Time Parameters: all default
Timeframe: M1
Allow to trade: Yes Both sides: Yes No limits No stops,
I am running the latest version of TradeStation version 1.11.011212
Any help would be much appreciated!! Thanks for your time!!
-JF
Re: OSMA (MACD Histogram) Strategy
Apprentice · Wed Jun 20, 2012 4:01 am
Fixed.
Re: OSMA (MACD Histogram) Strategy
jfost2010 · Wed Jun 20, 2012 9:40 am
Still no trades. I places some Signal statements in the code to see what is getting executed and it made it as far as this line:
if OSMA.HISTOGRAM:hasData(period-1) and OSMA.HISTOGRAM:hasData(period) then
there is never a true result for this line, also the line
elseif OSMA.HISTOGRAM:hasData(period-2) and ( SignalType == “TREND” or SignalType == “BOTH”) then
never has a true result.
My coding skills are limited but it looks like the values for OSMA:HISTOGRAM are null (or something) and the part of the code that makes the trades never gets hit.
I have the OSMA.lua indicator installed, but I see that you are populating the table with values from the MACD so I don’t think that is the issue.
Any ideas??
I appreciate your help and patience!! Thanks!!
-JF
Re: OSMA (MACD Histogram) Strategy
Apprentice · Thu Feb 19, 2015 5:44 am
Bump Up.
Re: OSMA (MACD Histogram) Strategy
SavvyStrategist · Thu Jun 18, 2015 3:57 pm
Does this strategy include alerts? Sounds, I mean, notifications. I’ve seen some custom strategies that require a separate file to be installed and I’m hoping this one does not.
Edit: It does. Sorry, I should have tried it out. It’s actually a very, very complete and comprehensive strategy, having many customizable options.
Re: OSMA (MACD Histogram) Strategy
SavvyStrategist · Fri Jun 19, 2015 3:02 pm
Could you combine this strategy with Bollinger Bands? Basically, I’m looking for an alert to sound when prices have touched BB and the OsMA indicator subsequently changes color. The exact criteria could be tricky, either too restrictive or too loose, so I would suggest something along the lines of:
-
A number of periods could be specified within which “prices reached BB, then OsMA changed color”. One period would be the default, so OsMA would have to change color on the very next candle close after prices reached the upper or lower Bollinger Band. Two, three, or perhaps even four periods could be considered. Without this option, I fear the strategy would be too unpredictable.
-
The number of standard deviations to consider for calculating Bollinger Bands, for the same reason. The default 2.0 standard deviations might be too restrictive, resulting in fewer signals. Somewhere between 1.8 and 2.0 might be more appropriate. Either way, it should be user-specifiable.
-
Being able to determine whether one wants buy or sell signals, as having both would be much too risky for such a sensitive set of indicators.
I sincerely hope this is possible.
Re: OSMA (MACD Histogram) Strategy
Apprentice · Mon Jun 22, 2015 2:41 am
Your request is added to the development list.
Re: OSMA (MACD Histogram) Strategy
Apprentice · Mon Jun 22, 2015 2:45 am
Strategys will provide audio / email alrts. _Alert Helper is used for indicators only. If we want to provide alert from within indicators.
After next TS update, alerts will get native support for indicatos. _Alert Helper will no longer be required.
Re: OSMA (MACD Histogram) Strategy
SavvyStrategist · Mon Jun 22, 2015 3:15 pm
Thanks for the clarification. In order to ease your workload, I thought I’d make an alternative suggestion/comment.
First things first: no matter what options I select in the second pane, the strategy still signals trades on both ends. There’s a tab that says something along the lines of: “define which side for trading and/or alerts”, but the “Buy” and “Sell” option change nothing as it always signals “Both”. Selecting “Direct” or “Reverse”, the option below, changes nothing as well.
In other words, I have it set up as “Histogram Top/Bottom” with no automated trading, only alerts, and want to specify the direction but the alert always signals on both ends.
Thanks for your prompt reply and I look forward to its next update.
Re: OSMA (MACD Histogram) Strategy
Apprentice · Tue Dec 13, 2016 5:07 pm
Strategy was revised and updated.