fxcodebase-backup
KDJ Indicator
Source: https://fxcodebase.com/code/viewtopic.php?f=48&t=66042
Forum: 48 · Topic 66042 · 1 post(s)
KDJ Indicator
Alexander.Gettinger · Wed May 02, 2018 11:37 am
K line is : K = ((Current Close – Lowest Low) / (Highest high – Lowest low))* 100
D is simple moving average of the K line. Usually D is 3 day simple moving average of K line but it depends on what trader wants to choose. We have used exponential average. D = N day simple moving average of K line
‘J’ is the divergence of ‘D’ value from the ‘K’ value. J = (3D) – (2K)
An example of a strategy rules:
Buy – When ‘J’ line crosses above the 50 mark Sell – When the ‘J’ line crosses below the 50 mark
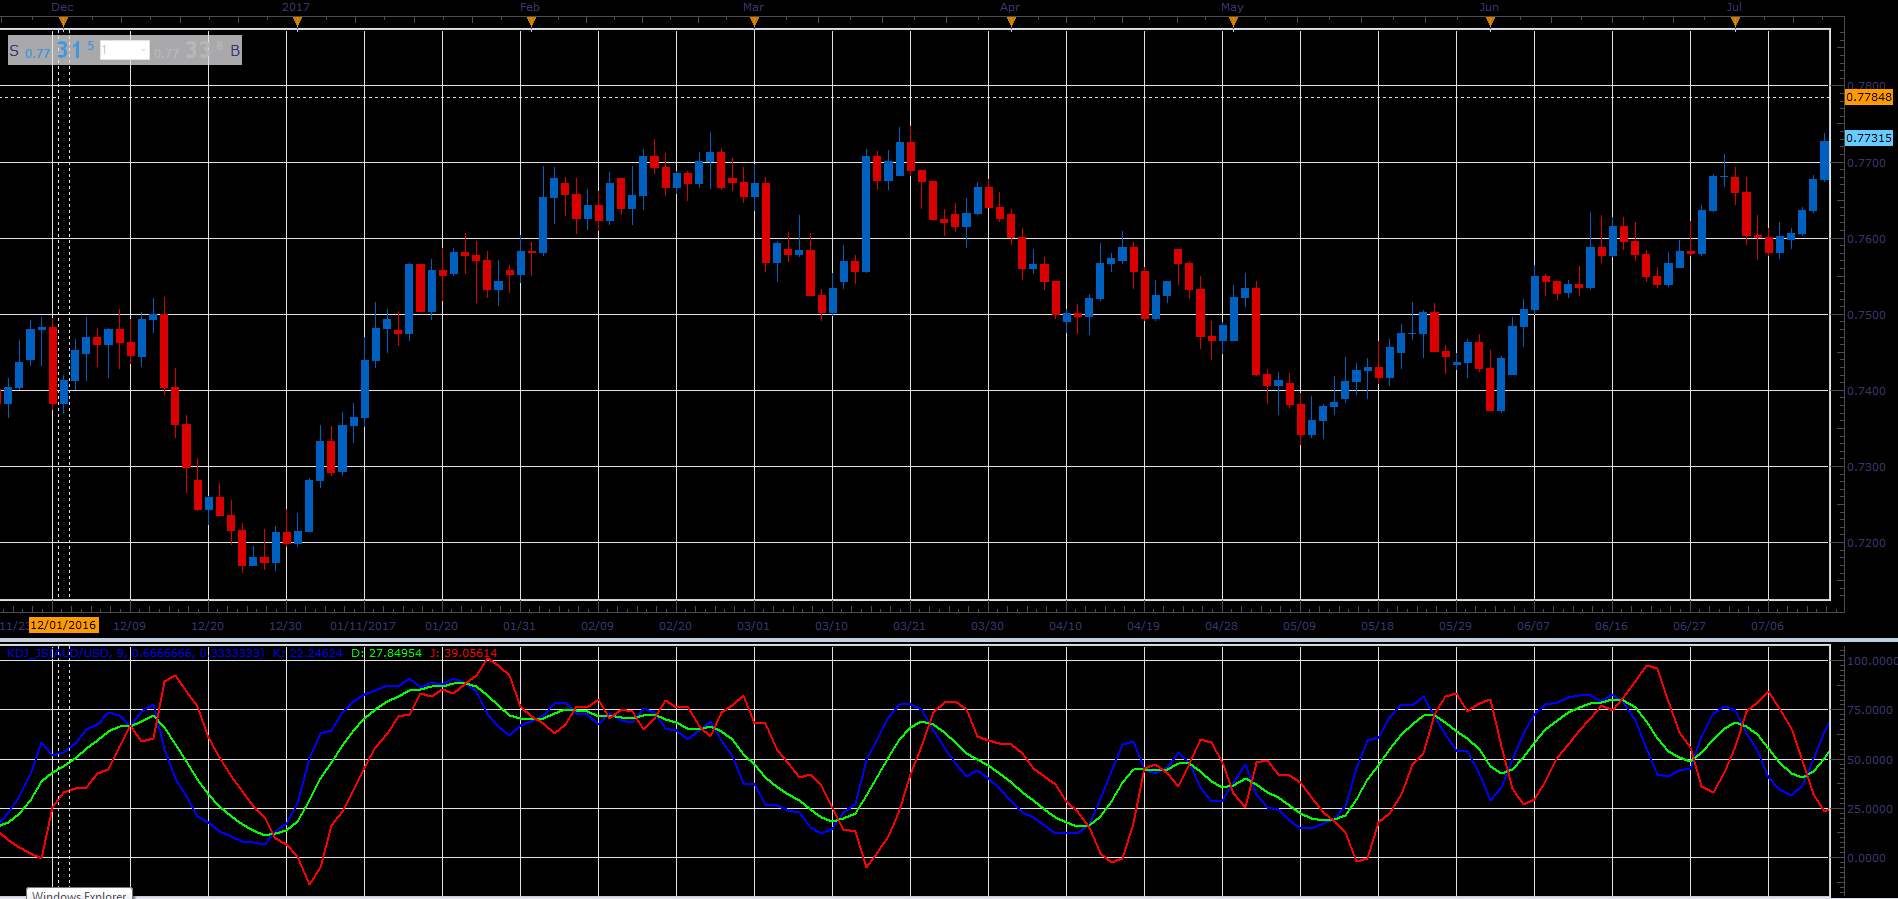
Download:
KDJ Averages:
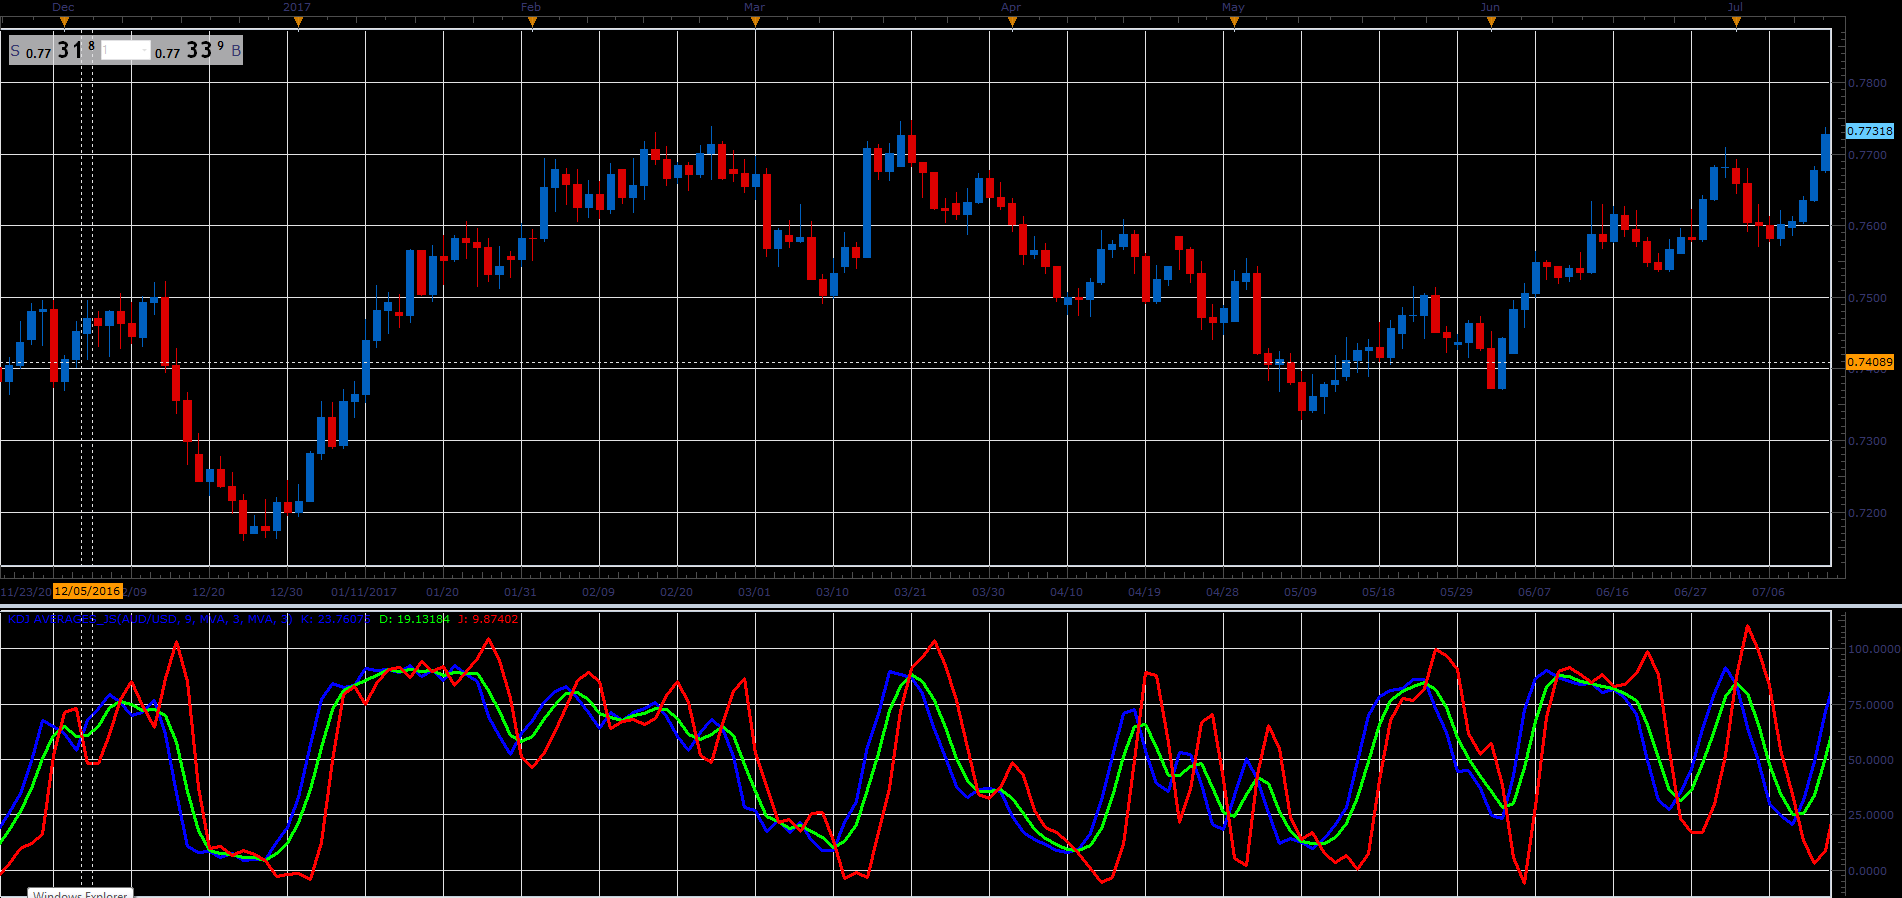
Download:
For this indicator must be installed Averages indicator (viewtopic.php?f=17&t=2430).