fxcodebase-backup
MACD Squeeze
Source: https://fxcodebase.com/code/viewtopic.php?f=48&t=68268
Forum: 48 · Topic 68268 · 1 post(s)
MACD Squeeze
Alexander.Gettinger · Sat Mar 30, 2019 3:39 pm
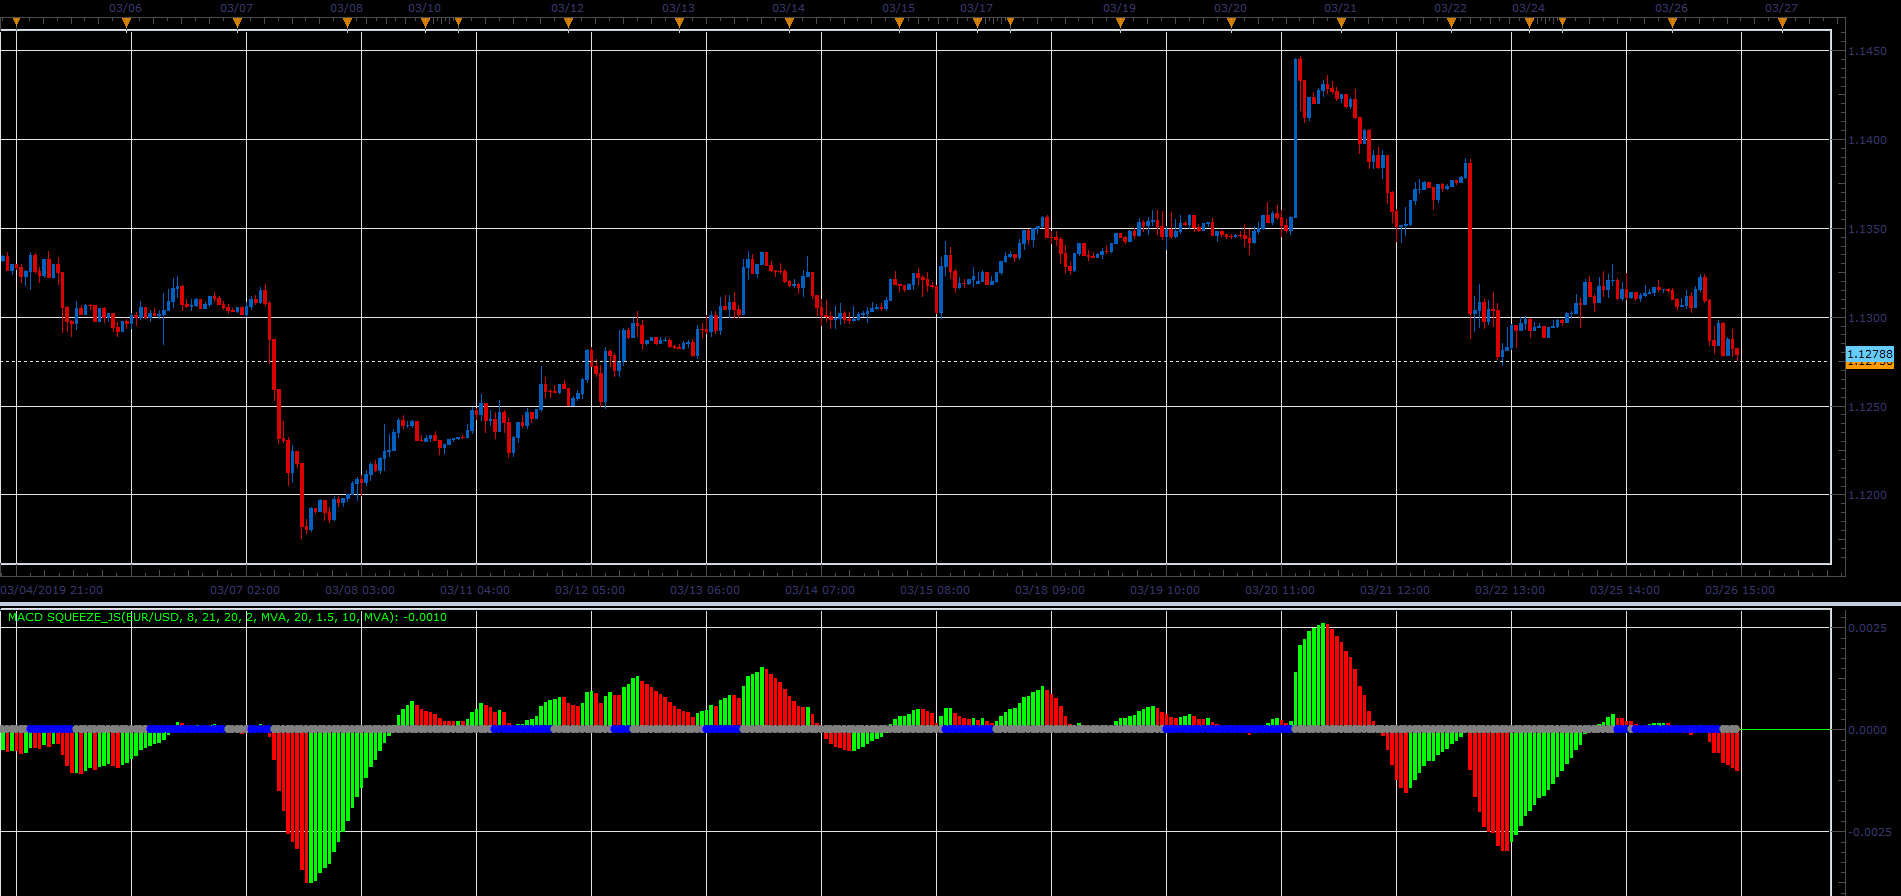
The MACD histogram is colored based on the squeeze The MACD line is colored based on RSI position vis-a-vis oversold/overbought.
Download: