fxcodebase-backup
MVA Range indicator
Source: https://fxcodebase.com/code/viewtopic.php?f=48&t=67103
Forum: 48 · Topic 67103 · 1 post(s)
MVA Range indicator
Alexander.Gettinger · Fri Dec 07, 2018 2:56 pm
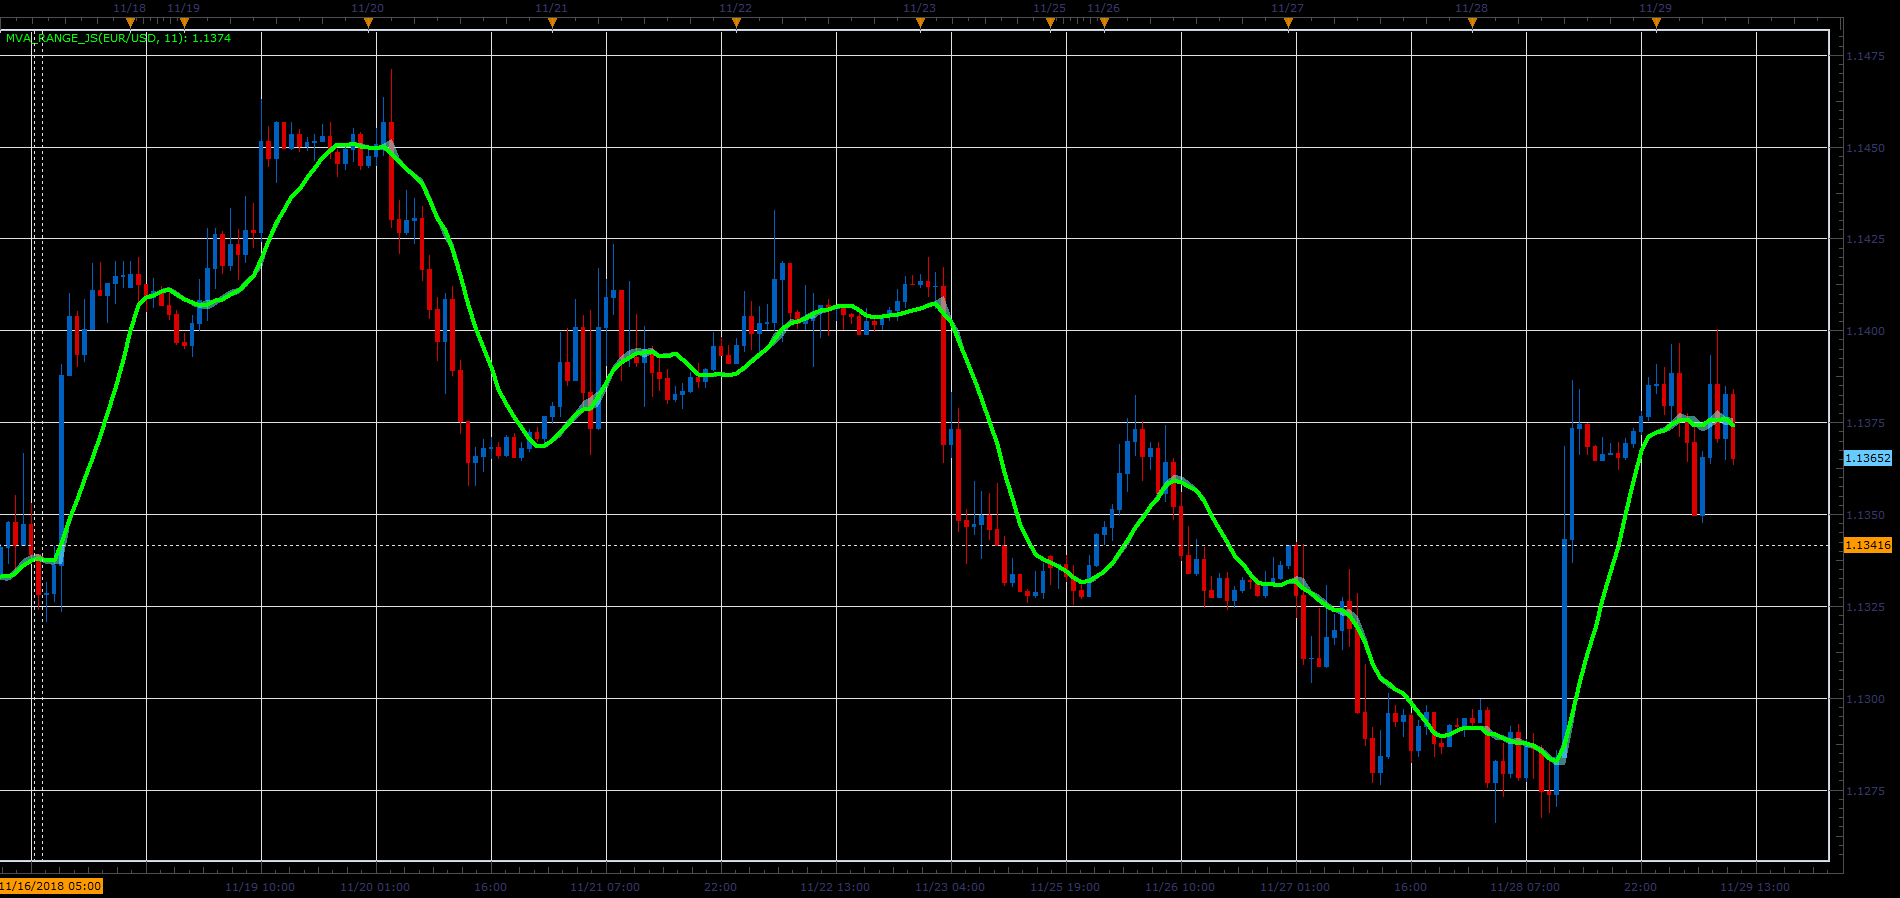
The indicator shows the range in which changed the MVA (simple moving average) during the each bar.
Formulas: MVA[i]=Sum[i]/Period, where Sum[i]=sum close prices in the range from (i-Period+1) to (i), Top of cloud=(Sum-Close+High)/Period and Bottom of cloud=(Sum-Close+Low)/Period.
Download: