fxcodebase-backup
Polynomial regression
Source: https://fxcodebase.com/code/viewtopic.php?f=48&t=65223
Forum: 48 · Topic 65223 · 1 post(s)
Polynomial regression
Alexander.Gettinger · Sat Oct 28, 2017 9:24 am
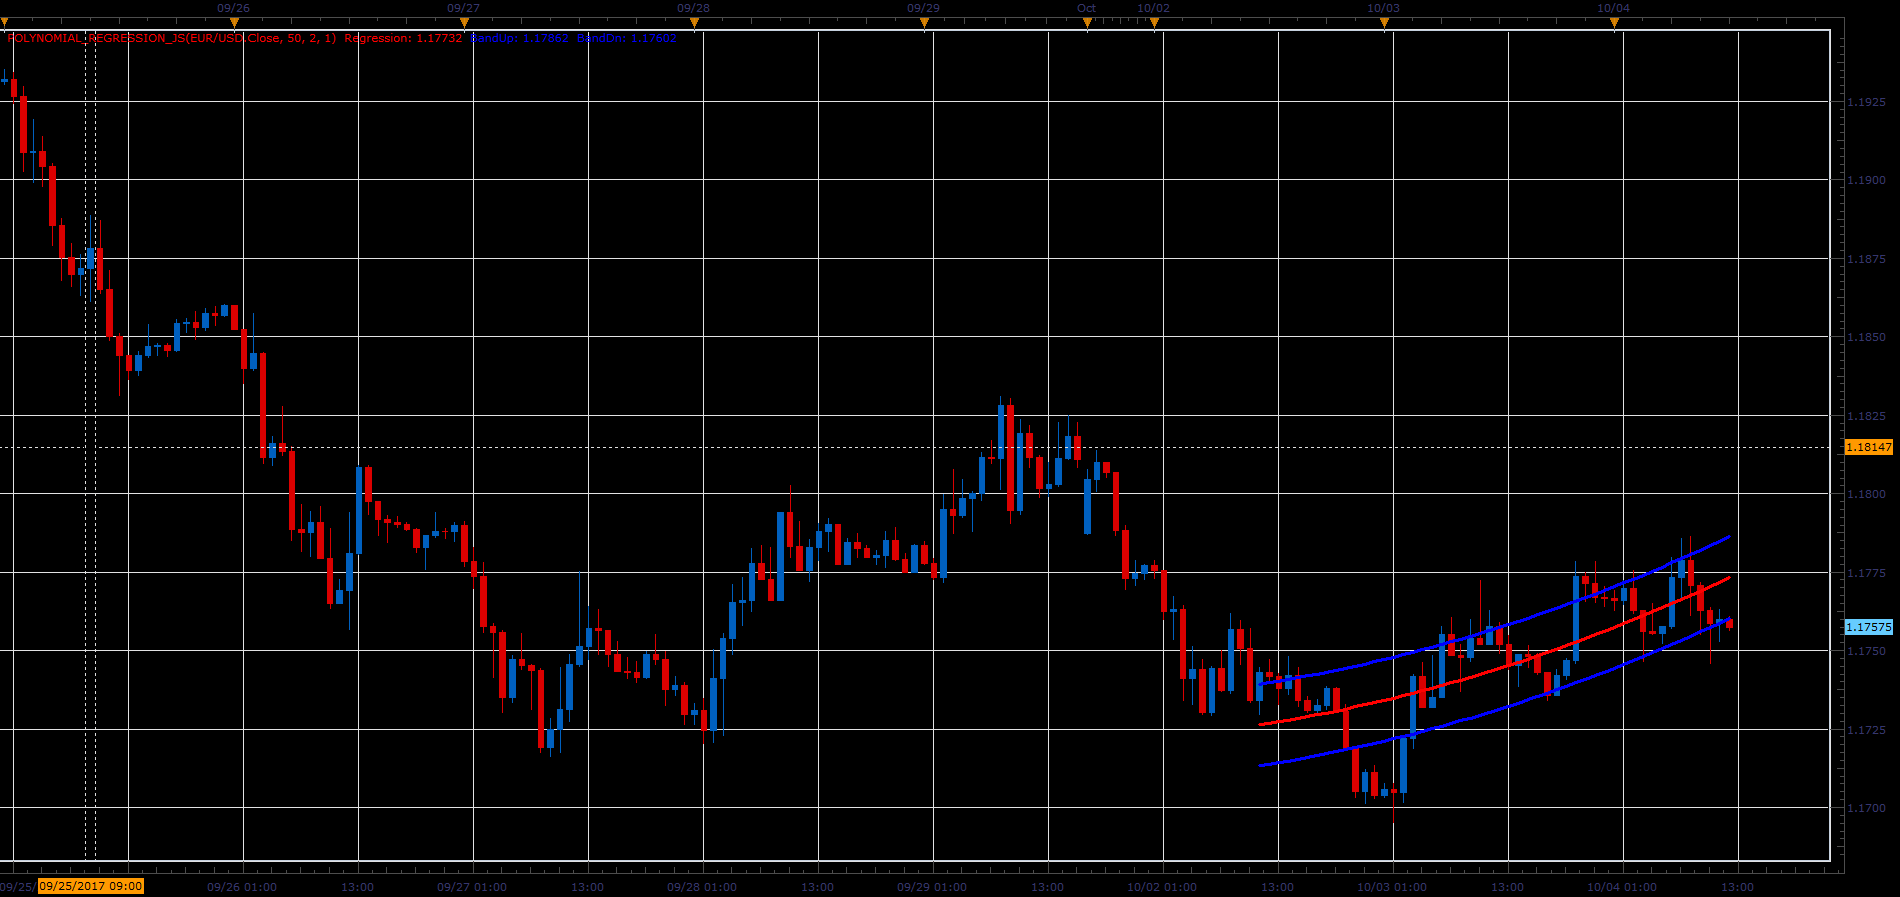
The indicator draws a regression curve that is best fits the prices between a starting price point and an ending point.
Parameter [Power] defines power of polynomial which will be used. [Period] defines range of data on chart. [Deviation] is used for building band.
If Power=1 we have a linear regression, if power=2 - quadratic regression and etc.
Download: