fxcodebase-backup
RSI Bar
Source: https://fxcodebase.com/code/viewtopic.php?f=48&t=65577
Forum: 48 · Topic 65577 · 1 post(s)
RSI Bar
Alexander.Gettinger · Sat Jan 06, 2018 5:37 pm
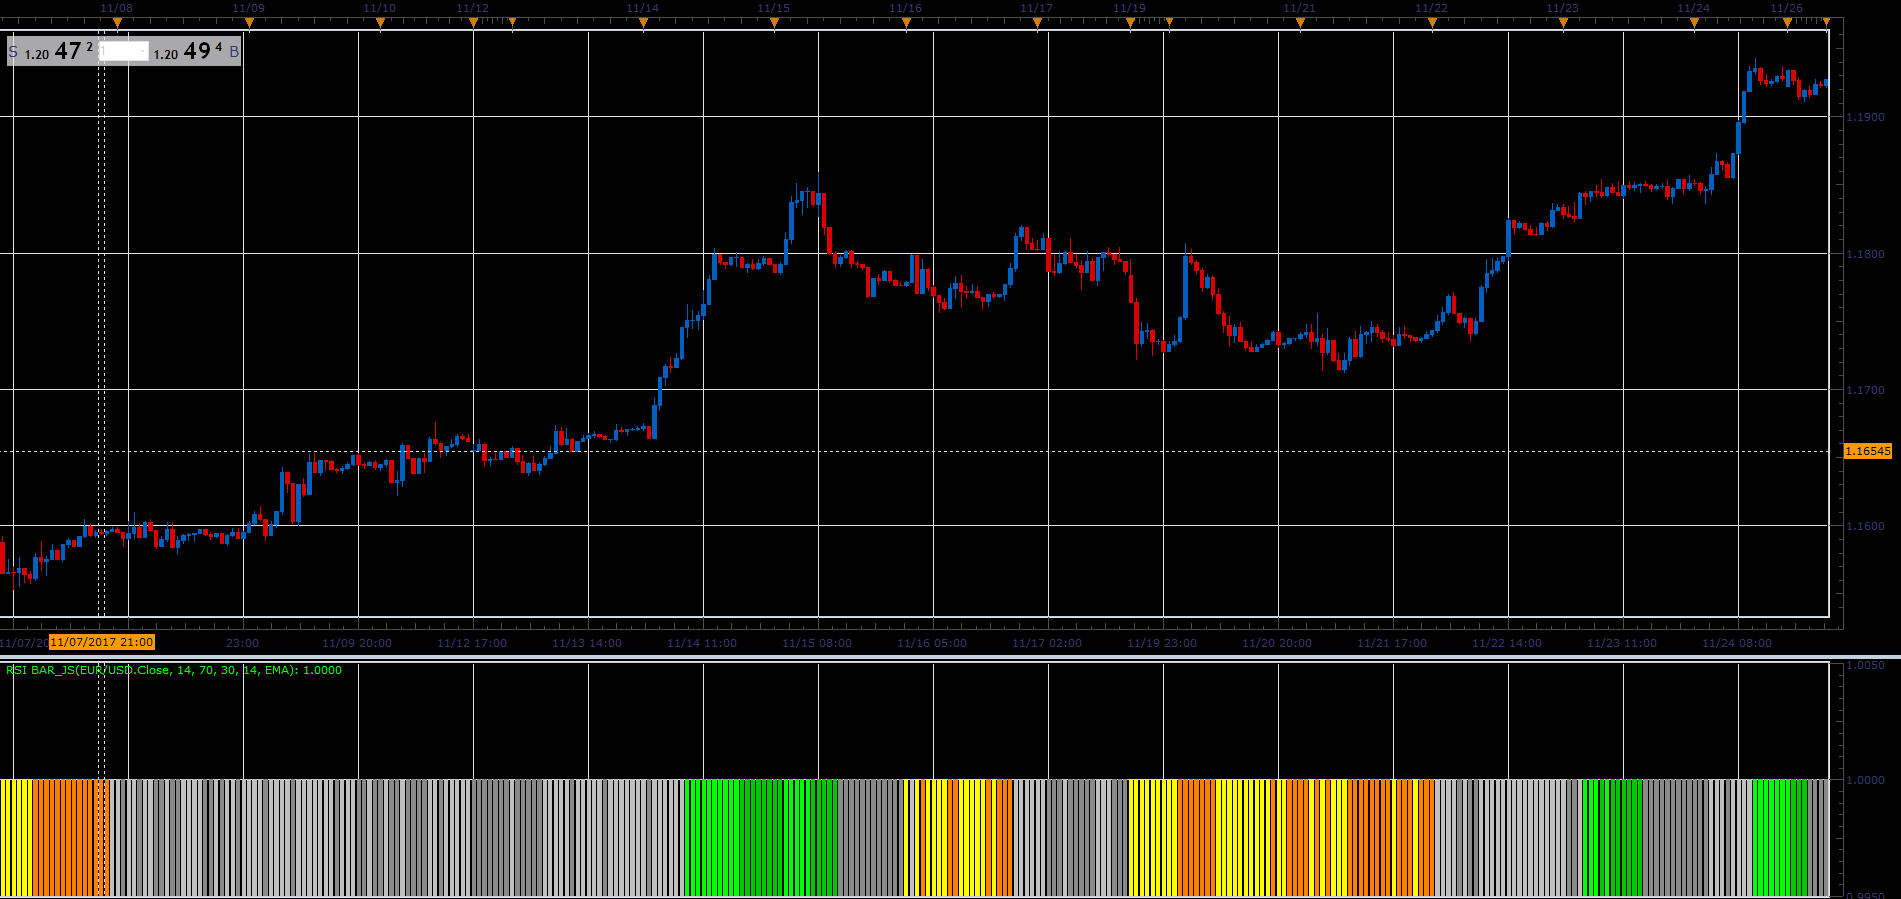
The indicator changes color depending on whether we are above or below the central line, in the overbought / oversold area. We use smoothed data , if you use 1 as smoothing period, You’ll have your regular RSI indicator, indication.
Download: