fxcodebase-backup
Stochastic RSI
Source: https://fxcodebase.com/code/viewtopic.php?f=48&t=65272
Forum: 48 · Topic 65272 · 1 post(s)
Stochastic RSI
Alexander.Gettinger · Sat Oct 28, 2017 11:57 am
The indicator was introduced by by Tuschar Chande and Stanley Kroll in December, 1992 Stocks and Commodities’ article and combines two indicators RSI and Stochastic.
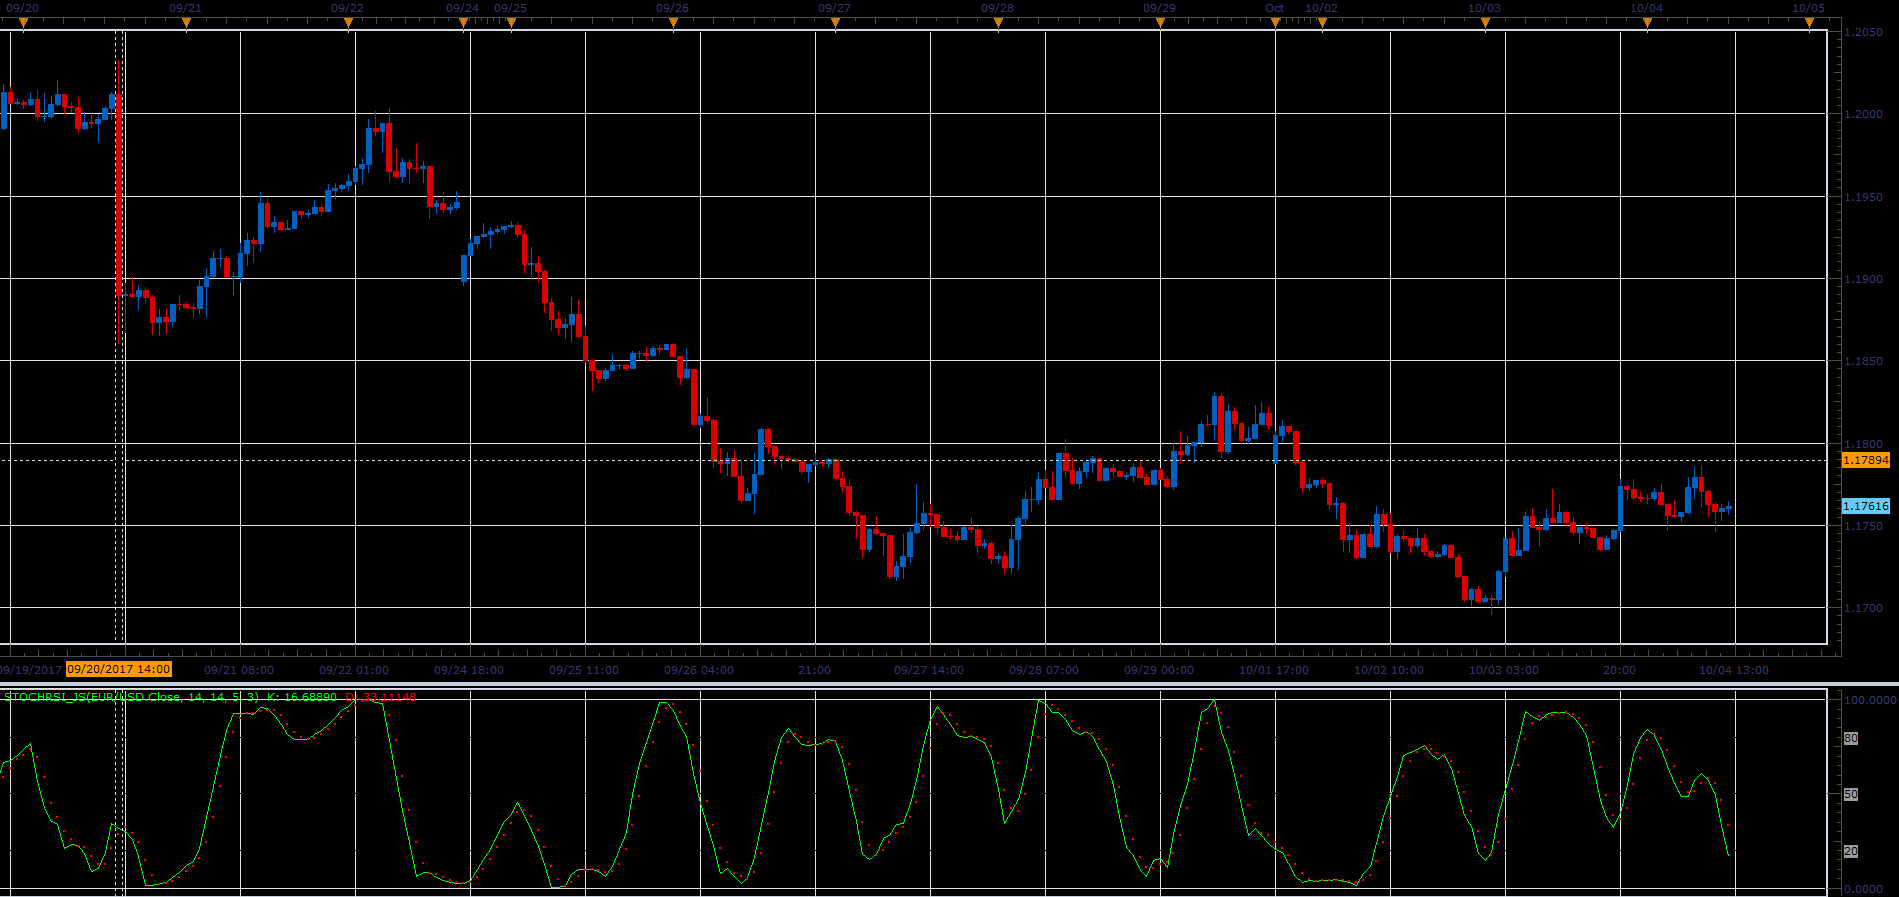
The Stochastic RSI Oscillator is a momentum indicator which shows the relation of the current RSI value relative to its high/low range over a given number of periods.
The indicator has four parameters: N - the number of periods for RSI calculation K - the number of periods to calculate the stochastic fast line SK - the number of periods to smooth the stochastic fast line (use 1 to do not smooth the fast line) D - the number of periods to calculate the stochastic slow line
The formula is: LR = Lowest RSI(PRICE, N) for K periods HR = Highest RSI(PRICE, N) for K periods FAST = MVA((RSI(PRICE, N)[now] - LR) / (HR - LR) * 100), SK) SLOW = MVA(FAST, D)
Download: