fxcodebase-backup
3 MA Bar histogram
Source: https://fxcodebase.com/code/viewtopic.php?f=38&t=65084
Forum: 38 · Topic 65084 · 5 post(s)
3 MA Bar histogram
Apprentice · Wed Sep 13, 2017 5:19 am
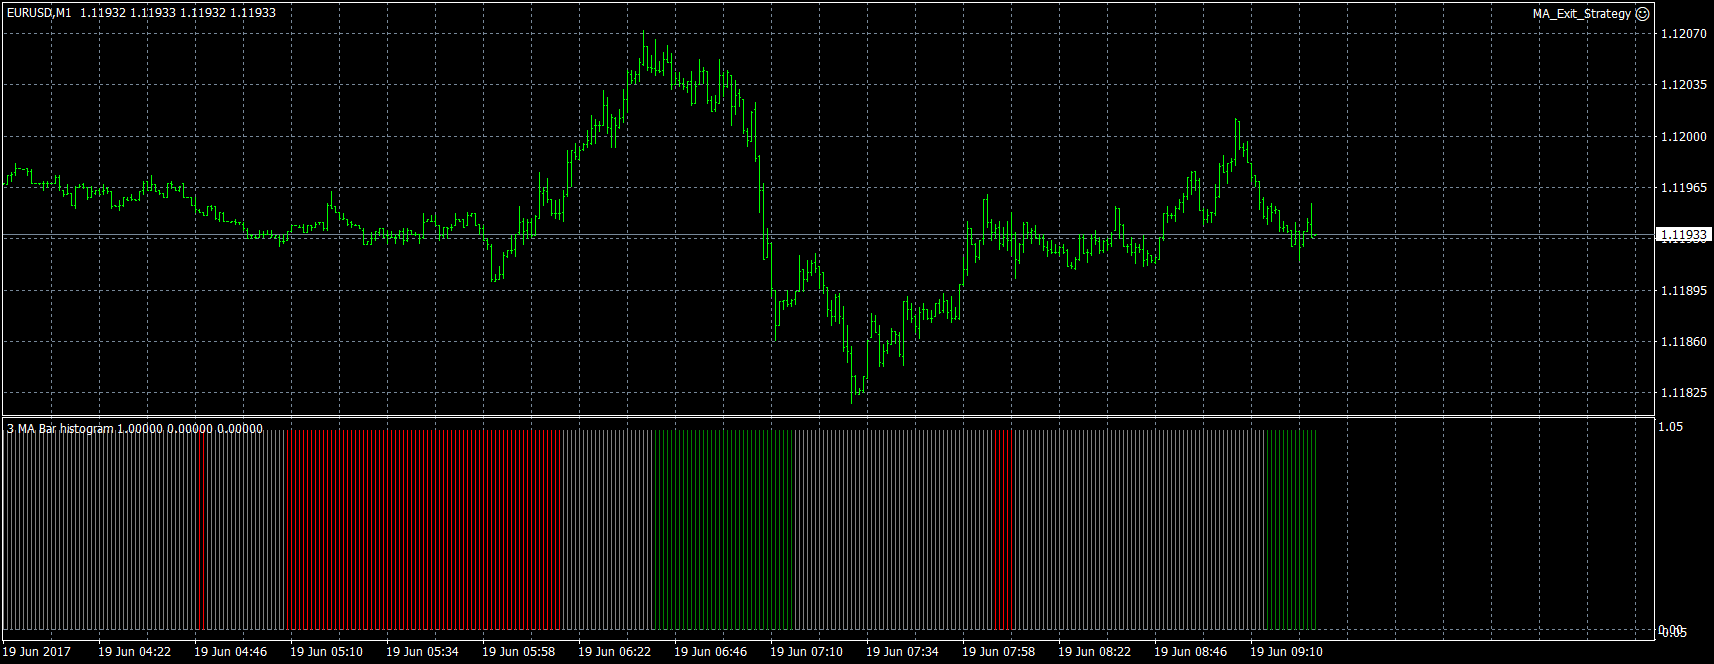
Based on TS2 / lua source. viewtopic.php?f=17&t=9634
ma1 > ma 2 > ma3 > ma4 > ma5 ——– green color ma1 < ma2 < ma 3 < ma 4 < ma 5———red color
Re: 3 MA Bar histogram
spinemaligna · Tue Mar 02, 2021 4:32 am
Hi there,
In an attempt to clean up my charts I applied this histogram to lose three mas from my screen. However it appears not to plot neutral areas when the mas are crossing. So when MA1 crosses below MA2 but remains above MA3 it plots a red bar instead of a grey one and vice versa. If I have got it right then the following should be the result: MA1>MA2>MA3=Green Bar MA3>MA2>MA1=Red Bar Any other combination=Grey Bar. At no time do I see a grey bar. Can this be fixed?
Thanks
Ross
Re: 3 MA Bar histogram
Apprentice · Tue Mar 02, 2021 5:08 am
Your request is added to the development list. Development reference 240.
Re: 3 MA Bar histogram
Apprentice · Thu Mar 04, 2021 12:59 pm
I don’t have any issues. It paint gray as well
Re: 3 MA Bar histogram
spinemaligna · Fri Mar 05, 2021 4:16 am
Having played with it I was asking it just to look at three MAs,9,13,21 EMA. If I populate all five slots with 9,10,13,14,21,22 it does show grey bars. Will have to test to see what difference that makes or can it be modidied to work with just three inputs or indeed is there an indicator that does that. Many thanks for your hard work.
Ross