fxcodebase-backup
Dasboard_Linear_Regresion_LNR
Source: https://fxcodebase.com/code/viewtopic.php?f=38&t=74734
Forum: 38 · Topic 74734 · 6 post(s)
Dasboard_Linear_Regresion_LNR
Apprentice · Mon Mar 25, 2024 6:15 pm
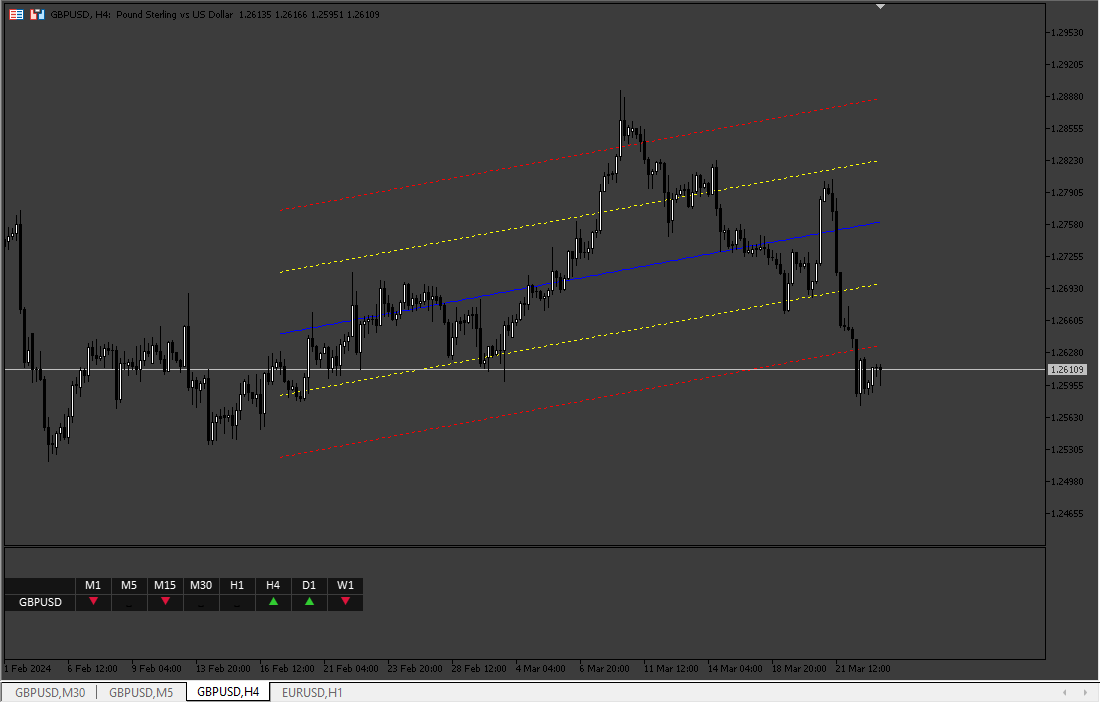
Based on the request. https://fxcodebase.com/code/viewtopic.php?f=27&p=154724
Dasboard_Linear_Regresion_LNR.mq5
Re: Dasboard_Linear_Regresion_LNR
logicgate · Mon Mar 25, 2024 8:01 pm
Thanks a lot buddy, seems to be working as requested, I will let you know if anything weird comes up.
I would have preferred that the dashboard were the drag and drop kind, on the chart, not on a subwindow though.
Best regards
Re: Dasboard_Linear_Regresion_LNR
logicgate · Tue Mar 26, 2024 5:10 am
Dear friend Apprentice,
I have been using the strategy tester to replay it and I think this would benefit from a little upgrade for a better visual representation of where price is.
Can you add an extra standard deviation to the lnrchannel?
Then price gets above or below the extra STD, we get a yellow arrow (does not matter if buy or sell area), yellow arrow means it’s overextended above/below extra STD.
Also, for us to heave at least an idea of where price is on the lnrchannel of other timeframes, we could get a gray arrow when price is above the central line (but below the upper lines), and a white arrow when price is bellow the central line (but above the lower lines).
I made a screenshot to explain:
Best regards
Re: Dasboard_Linear_Regresion_LNR
Apprentice · Wed Mar 27, 2024 10:01 am
We have added your request to the development list. Development reference 258
Re: Dasboard_Linear_Regresion_LNR
Apprentice · Mon Apr 08, 2024 4:50 am
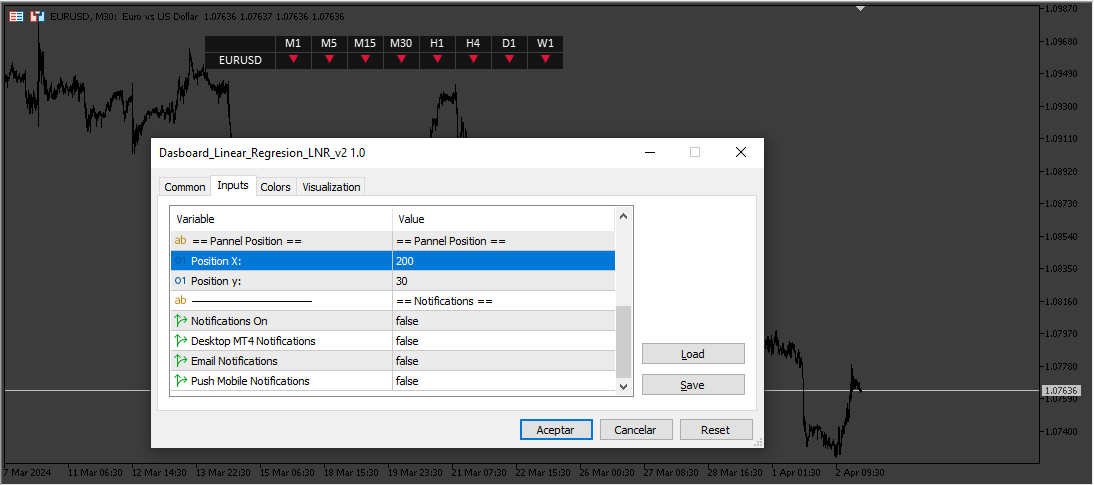
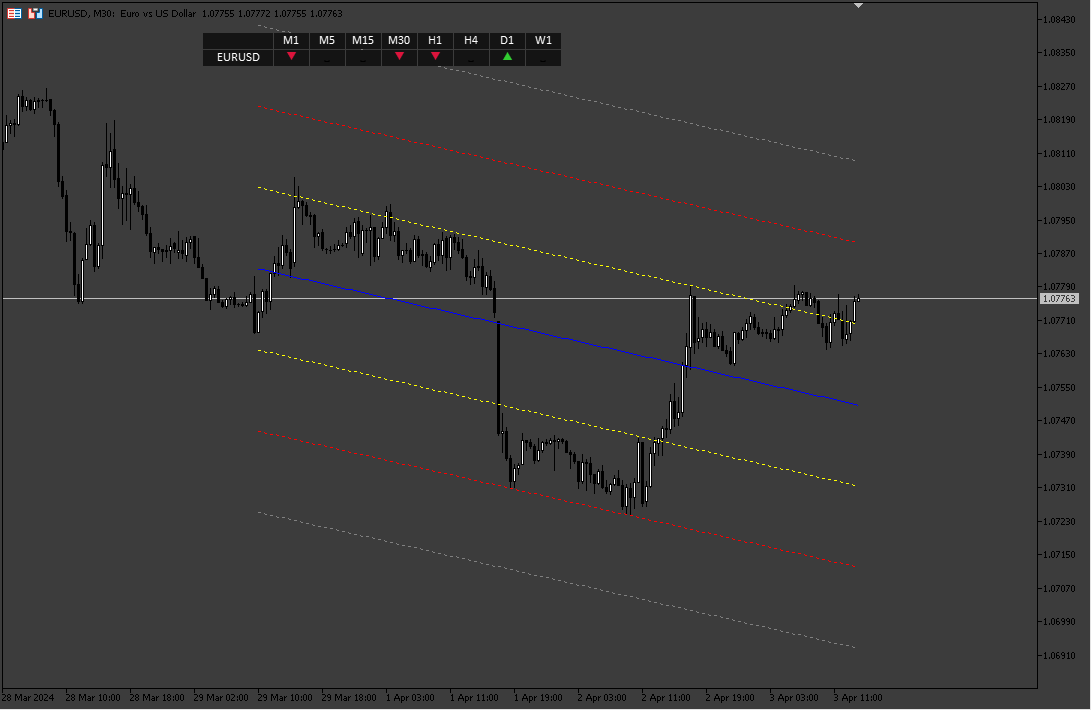
Dasboard_Linear_Regresion_LNR_v2.mq5
Re: Dasboard_Linear_Regresion_LNR
logicgate · Wed May 22, 2024 6:57 am
Thanks buddy!