fxcodebase-backup
RSI Zone Trade
Source: https://fxcodebase.com/code/viewtopic.php?f=38&t=63984
Forum: 38 · Topic 63984 · 1 post(s)
RSI Zone Trade
Apprentice · Mon Oct 17, 2016 1:53 pm
LUA Original: viewtopic.php?f=17&t=2345
Description:
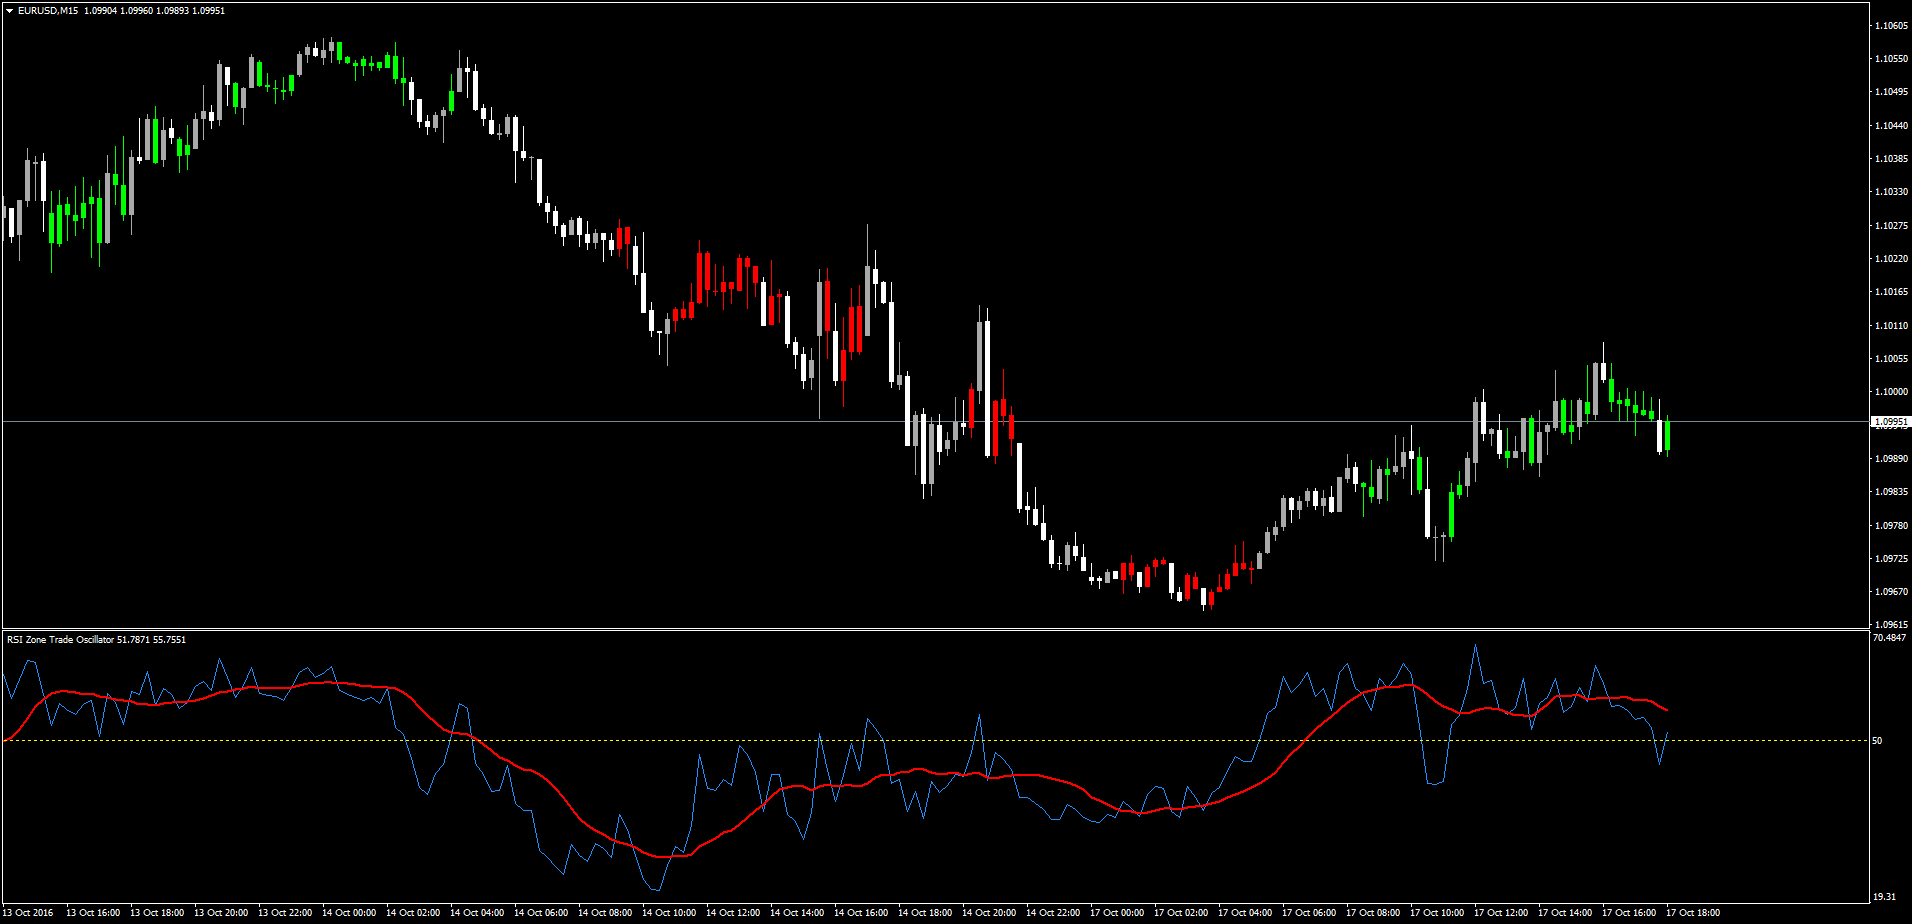
This indicator will color the candles according to the following conditions.
Positive Zone (green):
RSI (x) > 50 AND RSI(x) > Moving Average(X) of RSI
Negative Zone (Red):
RSI (x) < 50 AND RSI(x) < Moving Average(X) of RSI
An additional feature has been added: to select the inverse crossing of the RSI with the MA of that RSI, always at the same side of the 50 line for positive and negative analysis.
An Oscillator of those conditions has been incorporated as well for easier visualization.