fxcodebase-backup
Slope Direction Line / Moving Average Confirmation
Source: https://fxcodebase.com/code/viewtopic.php?f=38&t=64218
Forum: 38 · Topic 64218 · 1 post(s)
Slope Direction Line / Moving Average Confirmation
Apprentice · Fri Dec 16, 2016 10:07 am
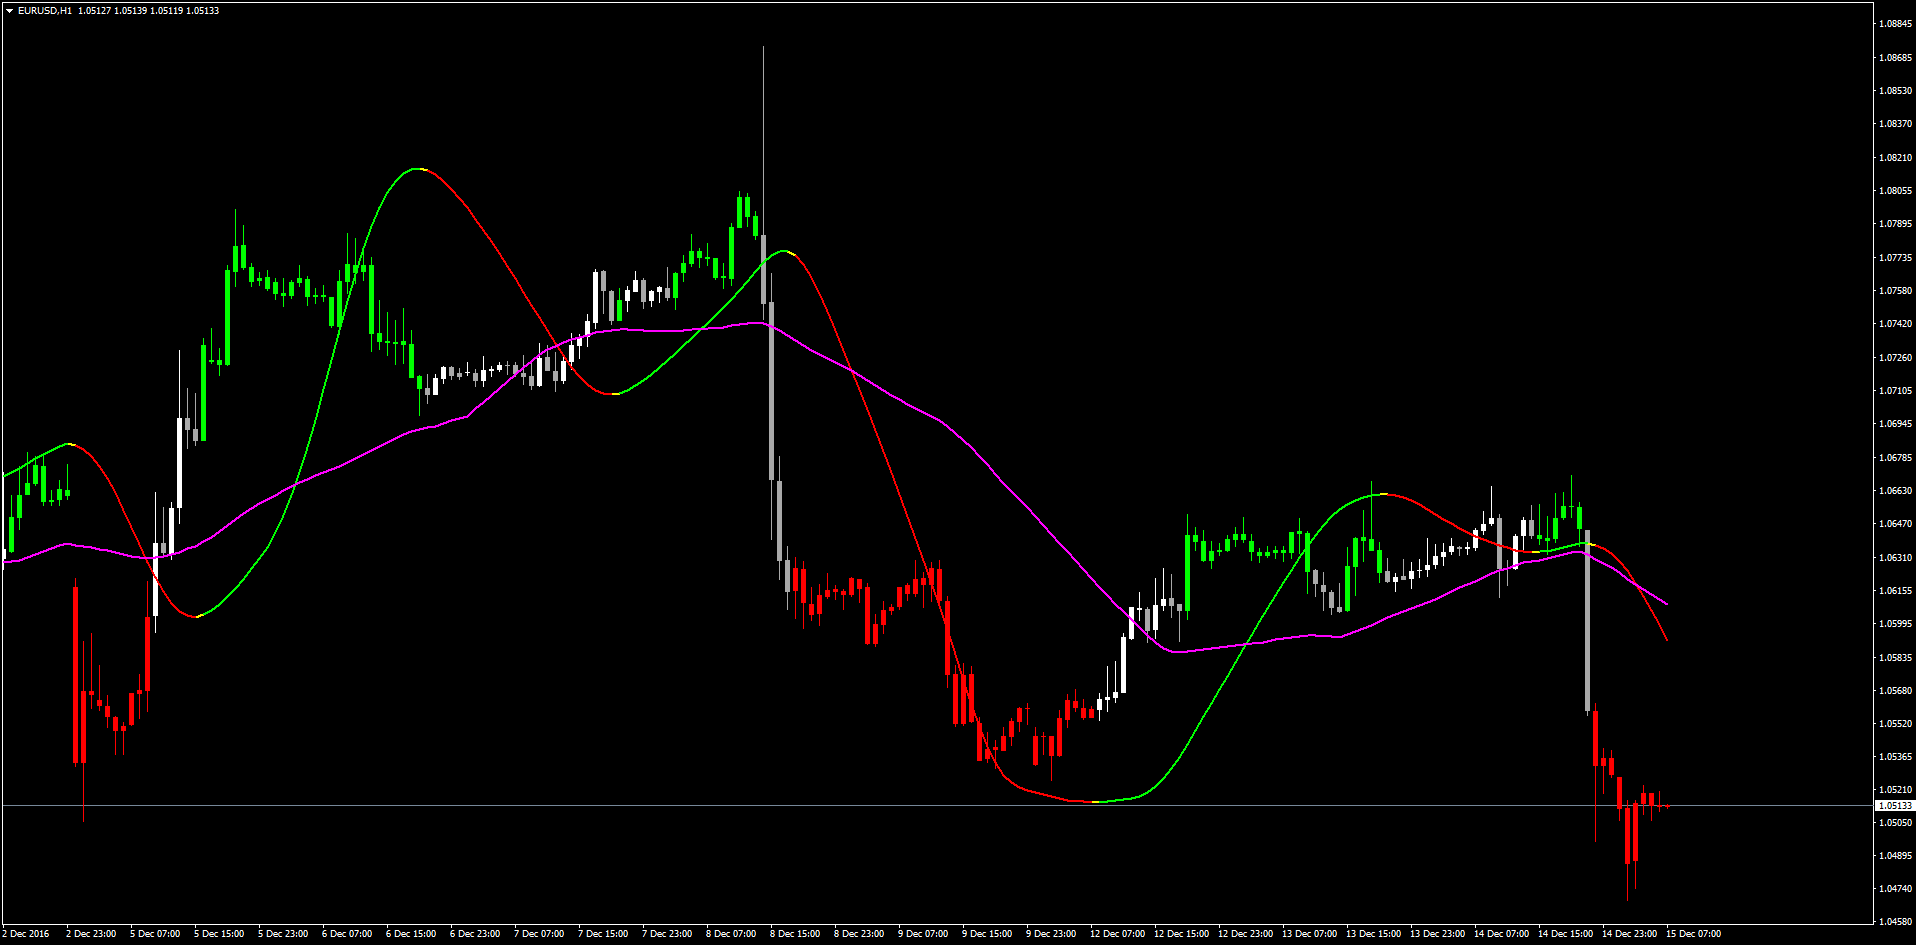
LUA Original: viewtopic.php?f=17&t=2648
Description:
This Price Overlay (Color Candles) Indicator shows when the Slope Direction Line and MA are in harmony.
When Current SDL > Previous SDL And Current MA > Previous MA Then Price Overlay is Green
Viceversa for the Down.
Make sure to uncheck the Chart on Foreground in the Chart Properties (F8).