fxcodebase-backup
USDX Slope
Source: https://fxcodebase.com/code/viewtopic.php?f=38&t=63997
Forum: 38 · Topic 63997 · 1 post(s)
USDX Slope
Apprentice · Thu Oct 20, 2016 3:37 am
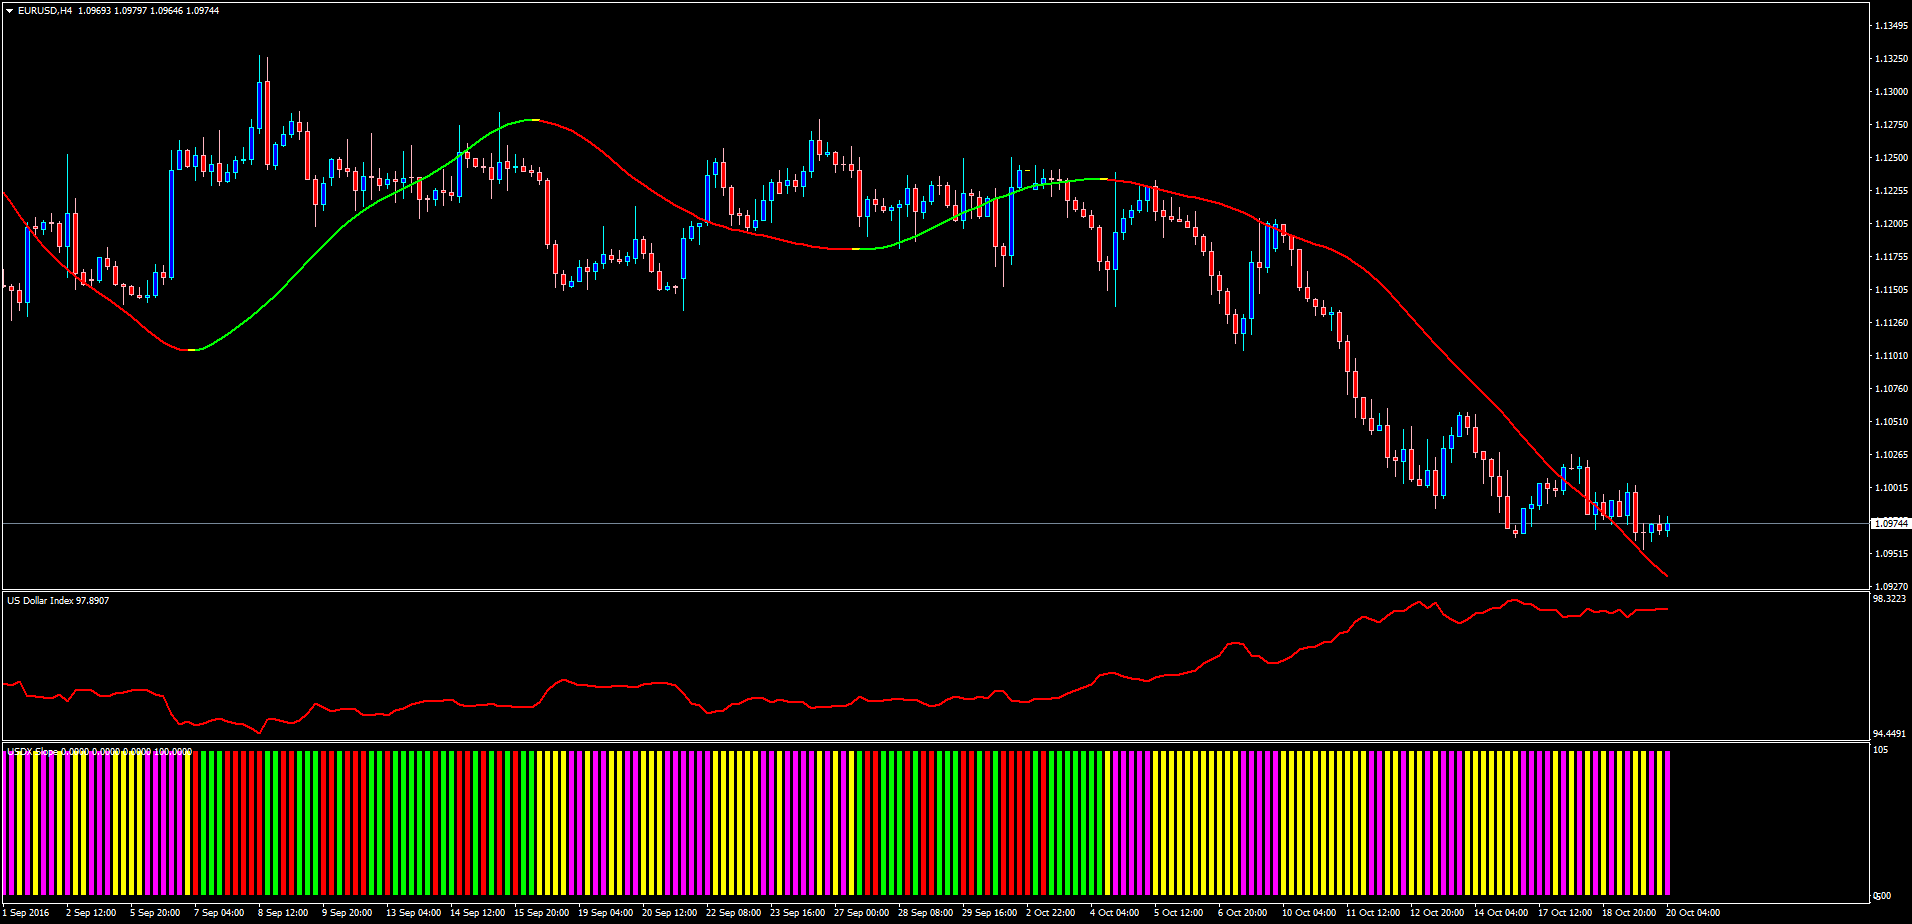
LUA Original: viewtopic.php?f=17&t=2304
Description:
This indicator (Colored Histogram) uses other 2 indicators:
-
Slope Direction Line (Attached independently): A Moving Average indicator that allows to assess the direction of the market by smoothing the trend using a vectorial formula. Any off the default Moving Averages can be used as source as well as the type of price and number of periods.
-
USDX (Also attached independently): The well known US Dollar Index, which is a geometrically-averaged calculation developed in 1973 by the US Federal Reserve of six currencies weighted against the U.S. dollar.
This USDX Slope Histogram will be colored according to the following scenarios:
UpUp: Slope Line going Up and current USDX greater than previous USDX (Lime) DnUp: Slope Line going up and current USDX lower than previous USDX (Yellow) UpDn: Slope Line going down and current USDX greater than previous USDX (Red) DnDn: Slope Line going down and current USDX lower than previous USDX (Magenta)
For ease of use, both calculations of the above described indicators were incorporated into the histogram.